Who experiences social exclusion?
Different groups of people in the community experience social exclusion in different ways.
Rates of social exclusion can vary by:
The highest rates of social exclusion
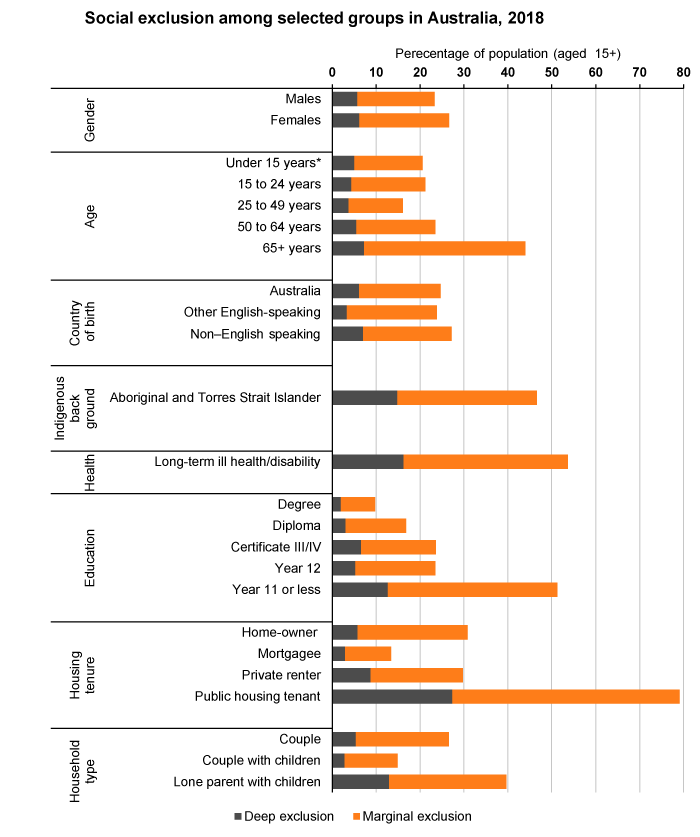
Using the latest annual data (2018), the graph below shows that certain groups continue to experience the highest rates of social exclusion:
- Women are more likely to be excluded than men.
- Some 44% of people over 65 experience exclusion – more than any other age group.
- Among Aboriginal and Torres Strait Islander people, 47% experience social exclusion.
- More than half of the Australians who have a disability or long-term health condition experience social exclusion.
- Early school leavers are three times as likely to experience exclusion as those with a diploma or degree.
- More than 36% of single-person and almost 40% of lone-parent households experience social exclusion.
- Public housing tenants experience social exclusion at more than twice the rate of people living elsewhere.

Data table
<
| Deep exclusion | Marginal exclusion | All social exclusion | |
|---|---|---|---|
| Gender | |||
| Males | 5.7 | 17.6 | 23.3 |
| Females | 6.2 | 20.4 | 26.6 |
| Age | |||
| Under 15 years* | 5.0 | 15.6 | 20.6 |
| 15 to 24 years | 4.4 | 16.8 | 21.2 |
| 25 to 49 years | 3.7 | 12.3 | 16.1 |
| 50 to 64 years | 5.5 | 18.0 | 23.5 |
| 65+ years | 7.2 | 36.7 | 43.9 |
| Country of birth | |||
| Australia | 6.1 | 18.6 | 24.7 |
| Other English-speaking | 3.4 | 20.4 | 23.8 |
| Non–English speaking | 7.0 | 20.2 | 27.2 |
| Indigenous background | |||
| Aboriginal and Torres Strait Islander | 14.8 | 31.8 | 46.6 |
| Health | |||
| Long-term ill health/disability | 16.2 | 37.4 | 53.7 |
| Education | |||
| Degree | 1.9 | 7.9 | 9.8 |
| Diploma | 3.0 | 13.8 | 16.9 |
| Certificate III/IV | 6.6 | 17.0 | 23.6 |
| Year 12 | 5.2 | 18.2 | 23.4 |
| Year 11 or less | 12.6 | 38.7 | 51.3 |
| Housing type | |||
| Home-owner | 5.8 | 25.0 | 30.8 |
| Mortgagee | 3.0 | 10.4 | 13.4 |
| Private renter | 8.7 | 21.0 | 29.8 |
| Public housing tenant | 27.3 | 51.8 | 79.1 |
| Household type | |||
| Couple | 5.4 | 21.2 | 26.6 |
| Couple with children | 2.8 | 12.1 | 14.9 |
| Lone parent with children | 12.9 | 26.8 | 39.7 |
| Single person | 11.4 | 25.2 | 36.6 |
The social exclusion monitor is the work of the Brotherhood of St. Laurence and the Melbourne Institute of Applied Economic and Social Research (MIAESR). This page was updated using analysis of Wave 18 of the HILDA Survey in October 2020.