Age
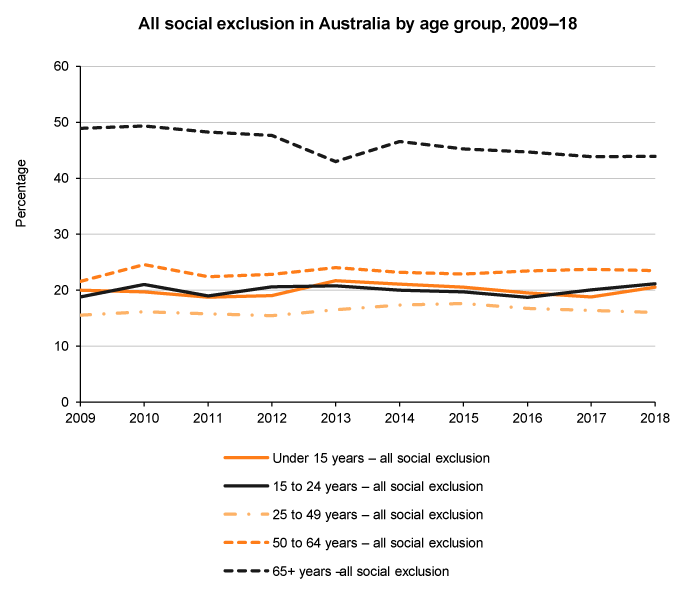
In measuring social exclusion we found that 44% of people aged over 65 years experience social exclusion, which is twice the rate of exclusion for other age groups.
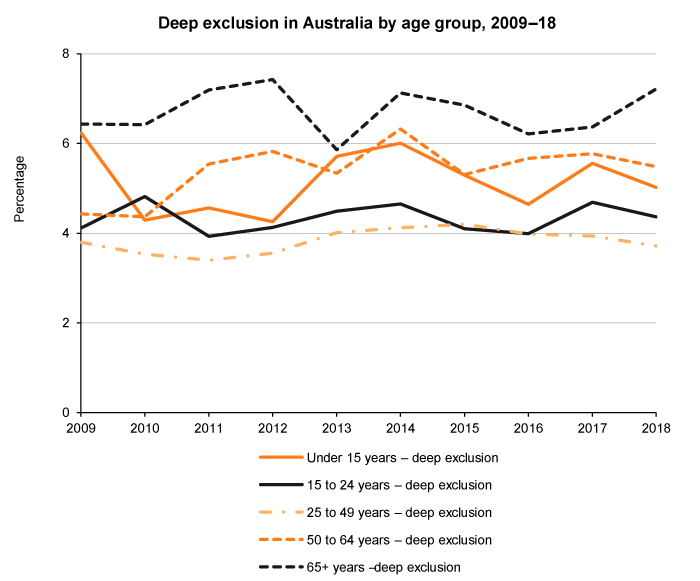
Deep social exclusion is also more likely to be experienced by older adults – 7% of those aged over 65 years in 2018.
After peaking for most age groups in 2010, social exclusion has remained relatively stable since 2011. An exception is the age group over 65 years, whose level of social exclusion has declined over the decade.
The graph immediately below shows all social exclusion, which is the total of marginal social exclusion and deep social exclusion. The second graph shows deep exclusion only.


Data table
| 2009 | 2010 | 2011 | 2012 | 2013 | 2014 | 2015 | 2016 | 2017 | 2018 | |
|---|---|---|---|---|---|---|---|---|---|---|
| All social exclusion | ||||||||||
| Under 15 years – all social exclusion | 20 | 19.7 | 18.8 | 19.1 | 21.7 | 21.1 | 20.6 | 19.6 | 18.8 | 20.6 |
| 15 to 24 years – all social exclusion | 18.8 | 21.1 | 19.0 | 20.6 | 20.8 | 20.0 | 19.7 | 18.7 | 20.1 | 21.2 |
| 25 to 49 years – all social exclusion | 15.5 | 16.1 | 15.8 | 15.5 | 16.5 | 17.4 | 17.6 | 16.8 | 16.4 | 16.1 |
| 50 to 64 years – all social exclusion | 21.6 | 24.6 | 22.4 | 22.8 | 24.1 | 23.2 | 22.9 | 23.4 | 23.8 | 23.5 |
| 65+ years – all social exclusion | 49.0 | 49.4 | 48.3 | 47.7 | 43.0 | 46.6 | 45.3 | 44.7 | 43.9 | 43.9 |
| Deep exclusion | ||||||||||
| Under 15 years – deep exclusion | 6.2 | 4.3 | 4.6 | 4.3 | 5.7 | 6.0 | 5.3 | 4.6 | 5.6 | 5.0 |
| 15 to 24 years – deep exclusion | 4.1 | 4.8 | 3.9 | 4.1 | 4.5 | 4.7 | 4.1 | 4.0 | 4.7 | 4.4 |
| 25 to 49 years – deep exclusion | 3.8 | 3.5 | 3.4 | 3.6 | 4.0 | 4.1 | 4.2 | 4.0 | 3.9 | 3.7 |
| 50 to 64 years – deep exclusion | 4.4 | 4.4 | 5.5 | 5.8 | 5.3 | 6.3 | 5.3 | 5.7 | 5.8 | 5.5 |
| 65+ years – deep exclusion | 6.4 | 6.4 | 7.2 | 7.4 | 5.9 | 7.1 | 6.9 | 6.2 | 6.4 | 7.2 |
About the social exclusion monitor
The social exclusion monitor is the work of the Brotherhood of St. Laurence and the Melbourne Institute of Applied Economic and Social Research (MIAESR). This page was updated using analysis of Wave 18 of the HILDA Survey in October 2020.