Persistence of social exclusion
By measuring social exclusion over a decade, we can see how persistent the experience of social exclusion is for people in Australia.
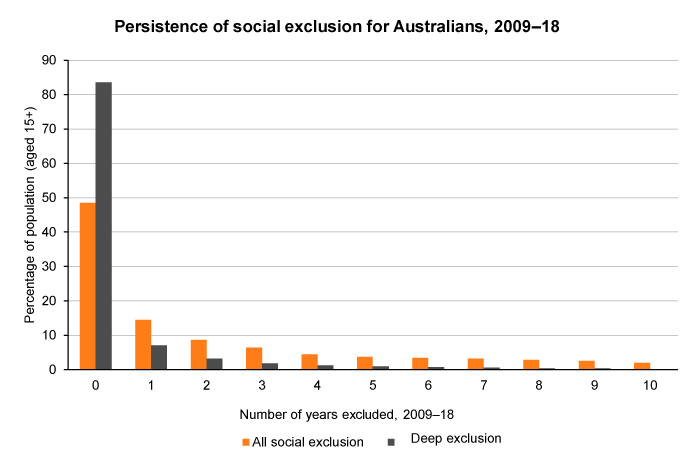
While almost half of Australians (48.5%) did not experience any social exclusion in the period 2009 to 2018, 51.5% were excluded in at least one year, and 16% were deeply excluded in at least one year.
The graph below shows in how many years people experienced social exclusion in the ten years from 2009 to 2018. The ‘all social exclusion’ bars in the graph show the total of marginal social exclusion and deep social exclusion.
See data table for this graph below.
For many Australians their experience of social exclusion is temporary. Of greatest concern are the people for whom exclusion lasts a long time: the 28% of people who were excluded to some degree in at least three years within this ten-year period from 2009 to 2018, and the 6% who experienced deep exclusion in at least three years. Social exclusion in at least three years within a decade is considered to be ‘persistent’ exclusion.
More about measuring social exclusion
Data table
| Number of years excluded 2009–18 | 0 | 1 | 2 | 3 | 4 | 5 | 6 | 7 | 8 | 9 | 10 |
|---|---|---|---|---|---|---|---|---|---|---|---|
| All social exclusion | 48.5 | 14.4 | 8.7 | 6.4 | 4.4 | 3.7 | 3.4 | 3.2 | 2.8 | 2.5 | 2.0 |
| Deep exclusion | 83.6 | 7.1 | 3.1 | 1.8 | 1.3 | 0.9 | 0.8 | 0.6 | 0.4 | 0.3 | 0.2 |
Who experiences social exclusion?
See results by:
The social exclusion monitor is the work of the Brotherhood of St. Laurence and the Melbourne Institute of Applied Economic and Social Research (MIAESR). This page was updated using analysis of Wave 18 of the HILDA Survey in October 2020.